Power Semiconductor Devices

More on this category »

Latest Post

Showing posts with label wind turbines. Show all posts

The importance of speed in Turbine’s measurements

The power output of a wind turbine is proportional the cube of the speed. The speed is the most important parameter in evaluating the power from a turbine. It is often understated by manufacturers or misunderstood by buyers that the power rating of a wind turbine is only true at a given speed, know as the rated speed, which is neither too low nor too high, but somewhere where it is trusted that the wind turbine will be able to withstand the forces of rotation. These speeds are distinguished into four different regimes (Figure 5.13):
  1. Start-up Speed – This is the speed at which the rotor and blade assembly begins to rotate.
  2. Cut-in Speed –
    Cut-in speed is the minimum wind speed at which the wind turbine will generate usable power. This wind speed is typically between 7 and 10 mph for most turbines.
  3. Rated Speed –
    The rated speed is the minimum wind speed at which the wind turbine will generate its designated rated power. For example, a "10 kilowatt" wind turbine may not generate 10 kilowatts until wind speeds reach 25 mph. Rated speed for most machines is in the range of 25 to 35 mph. At wind speeds between cut-in and rated, the power output from a wind turbine increases as the wind increases. The output of most machines levels off above the rated speed. Most manufacturers provide graphs, called "power curves," showing how their wind turbine output varies with wind speed.
  4. Cut-out Speed –
    At very high wind speeds, typically between 45 and 80 mph, most wind turbines cease power generation and shut down. The wind speed at which shut down occurs is called the cut-out speed, or sometimes the furling speed. Having a cut-out speed is a safety feature which protects the wind turbine from damage. Shut down may occur in one of several ways. In some machines an automatic brake is activated by a wind speed sensor. Some machines twist or "pitch" the blades to spill the wind. Still others use "spoilers," drag flaps mounted on the blades or the hub which are automatically activated by high rotor rpm's, or mechanically activated by a spring loaded device which turns the machine sideways to the wind stream. Normal wind turbine operation usually resumes when the wind drops back to a safe level.
Wind speeds for a wind turbine Figure 5.13 Wind speeds for a wind turbine

Measurement of speed of rotation

The following methods are used to measure the speed of rotation of an object: -
  • Mechanical Tachometer
  • Digital Tachometer
  • Stroboscopes
  • Magnetic Field Angular Position Sensors
  • Wheel Encoder
The choice of technique used for measurement is governed by the application range considered, degree of accuracy required, type of installation and original cost. In this section each type will be discussed and an overview of the importance of time measurement will also be discussed.
Mechanical Tachometer
This type of tachometer is a linkage of shafts, gears and rotating weights. When the input shaft which is seen horizontal rotates the vertical shaft it also rotates the weights attached to it which are hinged and free to move inward and outwards. The movement of these flyweights rotates a pointer which is calibrated to give the speed in desired units such as RPM.
Two main drawbacks of this are that the mechanical weights have inertia and hence not very accurate and secondly it does not give an indication of the direction of rotation.
Mechanical Tachometer Figure 5.8 Mechanical Tachometer
Electrical Tachometers
This type of tachometer could be as simple as a DC or AC generator that can determine the speed of shaft rotation by the amount of voltage the generator produces or the frequency of the output signal. The magnitude of the generator voltage and the frequency of the generated voltage will increase proportionally with speed. Frequency can also be measured by a photocell tachometer. The number of pulses produced by the photocell will increase as the speed of the shaft rotation increases.
The rotating field and the toothed rotor tachometers produce a waveform and the photocell uses a rotating disk that has a number of windows in it. A light source is positioned so that it will shine light through each window in the disk to a photocell detector as the disk spins. The disk is connected to the tachometer shaft, so when it turns the windows line up with the photocell and the photocell produces a pulse when it is struck by light. In each of these types of tachometers a pulse stream is produced and it is proportional to the speed of the tachometer shaft.
Digital Tachometer Figure 5.9 Digital Tachometer
Stroboscope
Also known as the “strobe”, is an instrument used to make a cyclically moving object appear to be slow moving, or stationary. The principle is used for the study of rotating, reciprocating, oscillating or vibrating objects. Machine parts and vibrating strings are common examples.
In electronic versions, the perforated disc is replaced by a lamp capable of emitting brief and rapid flashes of light. The frequency of the flash is adjusted so that it is an equal to, or a unit fraction below or above the object's cyclic speed, at which point the object is seen to be either stationary or moving backward or forward, depending on the flash frequency.
Stroboscope Figure 5.10 Stroboscope
In order to make a measurement, a mark is made on the object when it is stationary, and the object is spun up to speed. The oscillator is set to a low frequency to start with, and the LED is shone at the object where the mark is. At first, the mark will appear at random points around the object.
When it is stationary, the LED is flashing at the same frequency as the object is rotating. Since the frequency is known, the rotational speed is also known, and can be stated in RPM using the formula:
RPM = 60 × fstrobe
Magnetic Field Angular Position Sensors
These are similar shaft encoders, with one exception. They are capable of measuring the angle direction of a magnetic field from a magnet with <0.07° resolution. The advantages of measuring field direction versus field strength include: insensitivity to the temperature coefficient of the magnet, less sensitivity to shock and vibration, and the ability to withstand large variations in the gap between the sensor and magnet.
These sensors may be operated below 3 volts with a bandwidth response of 0-5 MHz. Output is a typical Wheatstone bridge permitting balanced output signals for noise immunity.
The main application of this sensor is to determine the angular position of a rotary axis. In this case, a permanent magnet is fixed on the engine axis just above the sensor. This magnet generates a directional magnetic field parallel to the surface of the sensor (Figure 5.11). This field works as a contactless interface between the orientation of the axis and the sensor.
The permanent magnet speed sensor Figure 5.11 The permanent magnet speed sensor.
Wheel encoder
Figure 5.12 shows an example of a typical encoder wheel. The resolution of the encoder wheel is determine by the number of cycles or complete phases.
55 Figure 5.12 Wheel Encoder
The encoder is a sensor attached to a rotating object (such as a wheel or motor) to measure rotation. A typical encoder uses optical sensor(s), a moving mechanical component, and a special reflector to provide a series of electrical pulses. These pulses can be used as part of a feedback control system to determine translation distance, rotational velocity of a rotating component.
For instance, to measure the time it takes motor to rotate exactly 360 degrees or more or less, an encoder would be ideal. The sensor would be fixed on the shaft (the encoder wheel) would rotate with the shaft. The output of an encoder would be a square wave, so if you hook up this signal to a digital counter or microcontroller you can then count the pulses. Knowing the distance/angle between each pulse, and the time from start to finish, you can easily determine position or angle or velocity of the motor.

Electrical Measurements

Energy related measurements concerned with electricity production and consumption are usually derived from three elements namely: the electrical current, voltage and resistance of the load. These three variables are directly linked with the energy or power consumption of the load and hence it is common to see a single meter combining these to give a direct reading of the energy consumption.
Multimeters are very useful test instruments. By operating a multi-position switch on the meter they can be quickly and easily set to be a voltmeter, an ammeter or an ohmmeter. Two devices can be used to measure the electrical measurements: analog and digital multimeters as shown below in Figure. 5.3.
Digital and Analog Multimeters Figure 5.3 Digital and Analog Multimeters
As far as power is concerned, the most common unit of power consumption measurement on the electricity meter is the kilowatt hour, which is equal to the amount of energy used by a load of one kilowatt over a period of one hour, or 3,600,000 joules. Some electricity companies use the SI mega joule instead. Modern electricity meters operate by continuously measuring the instantaneous voltage (volts) and current (amperes) and finding the product of these to give instantaneous electrical power (watts) which is then integrated against time to give energy used (joules, kilowatt-hours etc). The meters fall into two basic categories, electromechanical and electronic, as shown in Figure. 5.4.
The mechanical electricity meter has every other dial rotating counter-clockwise. The most common type of electricity meter is the Thomson or electromechanical induction watt-hour meter, invented by Elihu Thomson in 1888. it work by counting the revolutions of an aluminium disc which is made to rotate at a speed proportional to the power. The metallic disc is acted upon by two coils. One coil is connected in such a way that it produces a magnetic flux in proportion to the voltage and the other produces a magnetic flux in proportion to the current.
A modern digital electronic wattmeter/energy meter samples the voltage and current thousands of times a second. The average of the instantaneous voltage multiplied by the current is the true power. The true power divided by the apparent volt-amperes (VA) is the power factor. A computer circuit uses the sampled values to calculate RMS voltage, RMS current, VA, power (watts), power factor, and kilowatthours. The simple models display that information on LCD. More sophisticated models retain the information over an extended period of time, and can transmit it to field equipment or a central location.
Measurement of Power Figure 5.4 Measurement of Power
Wind speed is the most important factor directly proportional to the power output of a wind turbine.
Various types of anemometer are used to measure the velocity, usually of air.
The ‘cup type’ air speed measurement
(Figure 5.5) is used for free air and has hemispherical cups on arms attached to a rotating shaft. The shape of the cups gives a greater drag on one side than the other and results in a speed of rotation approximately proportional to the air speed. Velocity is found by measuring revolutions over a fixed time.
Cup Type Anemometer Figure 5.5 Cup Type Anemometer
The ‘vane anemometer’
(Figure 5.6) has an axial impeller attached to a handle with extensions and an electrical pick-up which measures the revolutions. A meter with several ranges indicates the velocity.
Vane Anemometer Figure 5.6 Vane Anemometer
The ‘hot-wire’ anemometer’
(Figure 5.7) is a probe terminating in an extremely small heated wire element when subjected to a fluid stream it cools to an extent, which depends on the velocity of the fluid passing. The resulting change in resistance of the element is measured by a bridge circuit and is related to velocity by calibration.
50 Figure 5.7 Hot-Wire Anemometer

THE UNIQUE ROLE OF WIND TURBINE STEP-UP (WTSU) TRANSFORMERS

Introduction:
Harnessing wind energy to perform work is not a new concept.
Since the earliest of times, wind power has been captured with sails to allow traders,merchants and explorers to ply their trades and discover the world around them.
On land, windmills have been used for irrigation, grinding grains, and performing crude manufacturing for centuries. Even the generation of electricity from wind power is not a new idea. What is new, however, is the scale at which this renewable energy source is being used today.
Early wind generation served a local need, often supplying power for isolated
equipment. Today, wind energy represents nearly 5% of the US electrical generation and is targeted to reach 20% in the foreseeable future.
For this to happen, wind turbine outputs need to be gathered, stepped-up to
transmission levels and passed across the nation’s interconnected power grid to the end users. The role of the Wind Turbine Step-Up (WTSU) transformer in this process is critical and, as such, its design needs to be carefully and thoughtfully analyzed and reevaluated in our view.
Historically this WTSU transformer function has been handled by conventional, “off the shelf” distribution transformers, but the relatively large numbers of recent failures would strongly suggest that WTSU transformer designs need to be made substantially more robust. WTSU transformers are neither conventional “off the shelf” distribution transformers nor are they conventional “off the shelf” power generator step-up transformers. WTSU transformers fall somewhere in between and as such, we believe, require a unique design standard.
Although off-shore wind farms using dry-type transformers are beginning to grow in popularity, for this discussion we will look only at liquid-filled transformers that are normally associated with inland wind farm sites.
Transformer Loading:
Wind turbine output voltages typically range from 480 volts to 690 volts. This turbine output is then delivered to the WTSU transformers and transformed to a collector voltage of 13,800 to 46,000 volts. The turbines are highly dependant upon local climatic conditions; and this dependency can result in yearly average load factor as low as 35%. Both conventional distribution transformers and power generator step-up transformers are typically subjected to more constant loading at, or slightly above, their theoretical maximum rating. This high level of loading stresses insulation thermally and leads to reduced insulation life. On the other hand, the relatively light loading of WTSU transformer has a favorable effect on insulation life but introduces two unique and functionally significant problems with which other types of conventional transformers do not have to deal.
The first problem is that, when lightly loaded or idle, the core losses become a more significant economic factor while the coil or winding losses become less significant and de-emphasized. Typically used price evaluation formulae do not apply to this scenario. NEMA TP1 and DOE efficiencies are not modeled for the operational scenario where average loading is near 30-35% and, consequently, should be cautiously applied when calculating the total cost of ownership for WTSU transformers
The second problem is that the WTSU transformer goes into thermal cycling as a
function of these varying loads. This causes repeated thermal stress on the winding,clamping structure, seals and gaskets. Repeated thermal cycling causes nitrogen gas to be absorbed into the hot oil and then released as the oil cools, forming bubbles within the oil which can migrate into the insulation and windings to create hot spots and partial discharges which can damage insulation. The thermal cycling can also cause accelerated aging of internal and external electrical connections.
These cumulative effects put the WTSU transformer at a higher risk of insulation and dielectric failure than either the typical “off the shelf” distribution transformer or the power generator step-up transformer experiences.
Harmonics and Non-Sinusoidal loads:
Another unique aspect of WTSU transformers is the fact that they are switched in the line with solid state controls to limit the inrush currents. This differs widely from the typical step-up transformer which must be designed to withstand high magnetizinginrush currents which cause core saturation, and in the extreme Ferroresonance.
While potentially aiding in the initial energization, these same electronic controls
contribute damaging harmonic voltage frequencies that, when coupled with the nonsinusoidal wave forms from the wind turbines, cannot be ignored from a heating point of view. Conventional distribution transformers do not typically see non-linear loads that require preventative steps due to harmonic loading. When a rectifier/chopper system is used, the WTSU transformer must be designed for harmonics similar to rectifier transformers, taking the additional loading into consideration as well as providing electrostatic shields to prevent the transfer of harmonic frequencies between the primary and secondary windings, quite dissimilar to conventional distribution transformers.
Transformer sizing and voltage variation:
WTSU transformers are designed such that the voltage is matched to the generator (e.g. wind turbine) output voltage exactly. There is no “designed in” over-voltage capacity to overcome voltage fluctuations, as is typically done on distribution and power transformer designs which allow for up to 10% over-voltage. Further, it should be noted that the generator output current is monitored at millisecond intervals and the generator limited to allow up to 5% over-current for 10 seconds before it is taken off the system. Therefore, the WTSU transformer size ( kVA or MVA) is designed to match the generator output with no overload sizing. Since overload sizing is a common protective practice with “off the shelf” distribution or power step-up generator transformers, the WTSU transformer design must be uniquely robust to function without it.
Requirement to withstand Fault Currents:
Typically, conventional distribution transformers, power transformers, and other types of step-up transformers will “drop out” when subjected to an under-voltage or overcurrent situation caused by a fault. Once the fault has cleared, the distribution transformer is brought back on-line either individually or with it’s local feeder in conjunction with automatic reclosures. Wind turbine generators, on the other hand, in order to maintain network stability are only allowed to disconnect from the system due to network disturbances within certain, carefully controlled network guidelines developed for generating plants. Depending upon the specific network regulations, the length of time the generator is required to stay on line can vary. During this time the generator will continue to deliver an abnormally low voltage to the WTSU transformer.Therefore, during near-to generator faults, the generator may be required to carry as low as 15% rated voltage for a few cycles and then ramp back up to full volts a few seconds after fault clearing. This means that the WTSU transformer must be uniquely designed with enough “ruggedness” to withstand full short circuit current during the initial few cycles when the maximum mechanical forces are exerted upon the WTSU transformer windings.
Since wind turbines must stay connected during disturbances in the network, the WTSU transformers must be designed to withstand the full mechanical effects of short circuits.
Conclusions:
The role of WTSU transformers in today’s wind generation scheme is unique; it’s design must be equally unique and robust. The combination of wide variations in loading; harmonic loads from associated control electronics and generators; sizing without protection for over-voltages, under-voltages or over-loading; and the requirement to “ride through” transient events and faults sets the WTSU apart from it’s more conventional, “off the shelf” counterparts. It is neither a conventional distribution transformer nor is it a conventional generator step-up transformer.
“Off the shelf” . . . doesn’t belong . . . “down on the farm”!

Wind Energy Measurements


previous Wind Turbines types and components


There are four measurements associated with wind energy, the measurements of electrical signals including voltage, current or collectively electrical power, wind turbine rotational speed and the wind speed.

Electrical measurements

In order to determine electrical energy output, it is necessary to be able to measure it either directly as energy in kWh, or indirectly by measuring the voltage, current of the generated output of the wind turbine.

Electrical measurements Ohms Law
Ohm's law states that the current (I) through a conductor between two points is proportional to the potential difference (V) and inversely proportional to the resistance (R).
36

Ohms Law
Figure 5.1 Ohms Law
Electrical Power
Electrical power (E) is the amount of energy produced.
The unit of measurement of Power being the Watt (W) with prefixes used to denote milliwatts (mW = 10-3W) or kilowatts (kW = 103W).
By using Ohm's law and substituting for V (volts), I (amps) and R (Ω)the formula for electrical power, E (watts) can be found as:
38


Alternating Current Power
As in the case with DC power, the instantaneous electric power in an AC circuit is given by
39 
But these quantities are continuously varying. Almost always the desired power in an AC circuit is the average power, which is given by
40
Where φ is the phase angle between the current and the voltage and where V and I are understood to be the effective or rms values of the voltage and current, see Figure 5.2. The term cos φ is called the "power factor" for the circuit, a power factor of one or "unity power factor" is the goal of any electric utility company since if the power factor is less than one, they have to supply more current to the user for a given amount of power use. In so doing, they incur more line losses. They also must have larger capacity equipment in place than would be otherwise necessary.
Resistive AC circuit Figure 5.2 Resistive AC circuit
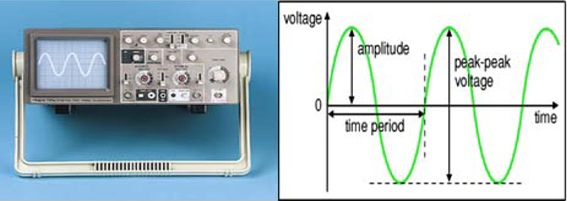
The difference between the maximum and minimum values is called peak-to-peak voltage (Vpp) and is twice the peak Voltage (Vp). The RMS voltage. (Vrms) is related to the peak voltage as:
42
Circuit currents and voltages in AC circuits are generally stated as root-mean-square or rms values rather than by quoting the maximum values. The root-mean-square for a current is defined by
43
That is, you take the square of the current and average it, then take the square root. When this process is carried out for a sinusoidal current
44
Since the AC voltage is also sinusoidal, the form of the rms voltage is the same. These rms values are just the effective value needed in the expression for average power:
45
Since the voltage and current are both sinusoidal, the power expression can be expressed in terms of the squares of sine or cosine functions, and the average of a sine or cosine squared over a whole period is = 1/2.
next Electrical Measurements

Environmental Impact from fossil fuels

previous Energy conversion
Coal, Oil and Natural gas have their relative merits in terms of availability, price and thermal performance. Table 1.3 below is constructed for comparison of the heat capacity, CO2 and SO2 production by the three fossil fuels. The 4th column is of particular importance in comparing all three fuels; it represents the quantity of carbon dioxide emitted for every unit of energy produced.
Coal produces the highest amount of Carbon dioxide for a given output of energy; then oil, then Natural gas which produces nearly half the emission of coal and a third less than that of oil.
The results displayed in table 1.3 for the production of CO2 mass per unit energy compares well with data published by the UK government, Action on Energy, the values found in this chapter are lower than those quoted in the reference, the difference is that the calculations shown in this chapter were only concerned with the combustion process itself; there other knock on effect in the calculations when the life cycle of the fuel is considered, hence the addition of energy used to transport, process the fuel, and to include distribution losses.
Fuel
Calorific
Value
MJ/kg
CO2
kg / kg fuel
CO2 / Energy
kg / MJ
SO2
kg / kg fuel
Coal
26
2.361
0.091
0.018
Oil
42
3.153
0.075
0.040
Natural
Gas
55
2.750
0.050
0
Table 1.3 Environmental impacts of fossil fuels
Energy world-wide
The consumption of energy by humankind has evolved over the ages. It began with the invention of fire, man relied on wood burning to cook and to provide warmth and light for millions of years. As civilization evolved, the needs for energy became greater and other sources were sought. In the long search, man discovered coal. Over the years coal provided much greater resource for energy, encouraging man to push its use into further applications.
A major leap in the nineteenth century was achieved by the discovery of oil in the Middle East. This unfortunate discovery eventually led to TWO World wars as the leading industrial nations attempted to dominate the world market and to secure the energy supply for their huge manufacturing industries. The oil crises due to the Arab-Israeli war in 1973 resulted in tripling of oil prices, this was a major shock for non producing countries, particularly in Europe, on one hand it has put tremendous increase on the energy consumer’s budget;
The discovery of oil pushed the competition for manufacturing beyond the industrialized countries own borders. This competition for shares in the exports market put so much strain on the consumption of fossil fuel. Hubbert put foreword his caution when he published his famous curve (1956), Figure 1.2. It is clear that the oil reserves of the world are consumed unsustainably and will be exhausted within this century. Humans have to find a new source or sources of energy to replace oil.
However, on the positive side, the depletion of oil can be considered as a major advantage to humankind and the environment, it will force consumers to reduce the excessive consumption of energy, it will help man to review manufacturing processes and attempt to increase energy efficiency, and probably it has already pushed governments to search for newer sources of energy. Substantial funds are allocated for the research into renewable resources such as Hydropower, wind turbines and solar energy.
Energy consumption world-wide has continued to rise, it is estimated that in 1900, the world consumption was around 22 EJ and by 1960 it rose to 128 EJ; this reached 564 EJ in 2000.
The continued increase in population and the associated increase in manufacturing industry to cater for greater dependence of man on energy driven devices and the culture of multi-car ownership has put even greater importance for energy. It is interesting to note that the energy consumption for individuals have increased by 10 folds over the century mentioned above. This is another proof that we are becoming too excessive and becoming too dependant on energy far greater than we did before.
3_thumb1 Figure 1.2 the first wake up call by Hubbert.

Energy conversion

previous Wind Turbines
It is important to understand that losses are encountered during the transformation of energy during the different conversions into the final form for a given application, for example consider a wind turbine, the following conversions take place:
Kinetic energy of the oncoming air strikes the rotor blades, turning them, and hence the axial kinetic energy is turned into mechanical energy of the rotating blades.
Some of this mechanical energy is lost in the control mechanism, consisting of the gear box and brake to regulate the speed and match it with that of the generator. Some energy losses are encountered due to friction.
The shaft turning with the remaining energy will rotate in turn the generator; hence converting it’s the output into electrical energy (mechanical to electrical).
Some losses are dissipated through the mechanical connections between the turbine and the electrical generator.
Electricity is used by customers for lighting / heating or to operate electric devices such as radio, television, etc. electrical devices are designed to operate on an optimum condition; efficiency of the operation will vary depending on its use, age and maintenance.
The energy flow for a typical wind turbine is shown in Figure 1.1; can be analysed in a simple way by considering the energy flow diagram, which may look like this:
100 units of energy are stored in the incoming air as kinetic energy.
40 units are converted into rotational /mechanical energy by the blades.
35 units are transferred by the shaft; some units are absorbed by the brake and gear.
33 units are converted from mechanical into electrical energy in the electrical generator.
30 units is the net output, as 3 units are lost in voltage conversion, storage and distribution.
The final figure depends on many factors, including the type of turbine, efficiency of the control system, efficiency of the generator, and the quality of the transformer and the distribution system.
Energy conversions in a typical Wind Turbine Figure 1.1 Energy conversions in a typical Wind Turbine.
From \ To Mechanical Electrical Thermal Chemical Nuclear
Mechanical
Gear Nutcracker push mower
Electric generator
friction
x
Electrical
Electric
motor
Light bulb
Electric fire
Electrolysis
Particle
accelerator
Thermal
Steam
turbine
Thermocouple
Heat
exchanger
x
Fusion
reactor
Chemical
jet engine
Rocket
Battery fuel cell
Car engine
Boiler
Intermediate
reaction
x
Nuclear
x
x
Nuclear
reactor
x
x
Table 1.1 Energy conversion matrix

Wind Energy


previous Environmental Impact from fossil fuels


Wind Power developments Figure 2.1 Wind Power developments
According to BWEA, the British Wind Energy Authority, in the UK currently there are 2896 large Wind turbines with installed capacity of 4532 MW, sufficient to supply over 2.5 million homes (based on annual household energy consumption of 4.7 MWh).
Much attention has been paid recently to Renewables as a potential source of fuel. The rising oil price and the logistics in supplying fossil fuel to remote areas are the main drive to Renewables as well as the environmental incentive. In remote locations, stand-alone Renewable energy systems can be more costeffective than extending a power line to the electricity grid. In addition, the environmental benefits under the current international concerns on global warming makes such project much more valuable and rewarding.
The growth of renewable energy sources also stimulates employment, the creation of new technologies and new skills.
The new Directive on renewable energy sets ambitious targets for all Member States, such that the EU will reach a 20% share of energy from renewable sources by 2020 and a 10% share of renewable energy specifically in the transport sector. It also improves the legal framework for promoting renewable electricity, requires national action plans that establish pathways for the development of renewable energy sources including bioenergy, creates cooperation mechanisms to help achieve the targets cost effectively and establishes the sustainability criteria for Biofuels. The new Directive should be implemented by Member States by early in 2010.
In a recent statement, Ed Miliband, UK Secretary of State for Energy and Climate change he spelled out the government strategy:
“Transforming the country into a cleaner, greener and more prosperous place to live is at the heart of our economic plans for 'building Britain’s future' and ensuring the UK is ready to take advantage of the opportunities ahead”.
By 2020:
  • More than 1.2 million people will be in green jobs.
  • 7 million homes will have benefited from whole house makeovers, and more than 1.5 million households will be supported to produce their own clean energy.
  • Around 40 percent of electricity will be from low-carbon sources, from Renewables, nuclear and
    clean coal.
  • We will be importing half the amount of gas that we otherwise would.
  • The average new car will emit 40 percent less carbon than now.
Siting of Wind turbines
The placement or "siting" of wind systems is extremely important. In order for a wind turbine system to be effective, a relatively consistent wind-flow is required. Obstructions such as trees or hills can interfere with the rotors. Because of this, the rotors are usually placed on towers to take advantage of the stronger winds available higher up. Furthermore, wind speed varies with temperature, season, and time of day. All these factors must be considered when choosing a site for a wind-powered generator.
The amount of Wind Energy available at any location depends on two sets of factors:
  1. Climatic factors including: Time of day, Season, Geographic location, Topography, and Local weather.
  2. Mechanical factors including: Diameter of rotor, and Type of Turbine
Utility-scale wind farms must have access to transmission lines to transport energy. The wind farm developer may be obligated to install extra equipment or control systems in the wind farm to meet the technical standards set by the operator of a transmission line.
Wind farm, off shore, or on shore Figure 2.2 Wind farm, off shore, or on shore.
Planning Constraints for wind turbines:
There is a number of planning related issues that may make it difficult for you to install a turbine on your site and it would be wise to ensure that you are not going to fall foul of any of these before proceeding.
  • Military installations
    Avoid these installations, especially if it is an air force base or communication centres.
  • Proximity to built-up area
    When housing estates are concerned, ideally consider a distance of at least 200m - 300m depending on the size of the turbine.
  • Designated areas or listed buildings
    National Parks or Areas of Outstanding Natural Beauty are more difficult to satisfy the local planning officer to install a wind turbine on it or near it.
next Steps to Planning and Building a Wind Farm

Steps to Planning and Building a Wind Farm

There are many stages of development before a wind turbine/farm can be approved and built. Once a site has been selected for its good overall potential, work begins on several main tasks:
  • Consultation with the local authority
    It is extremely important to contact the local authority in the area where the turbine is considered before committing any time or costs. Engage them early in the planning process, answer any questions and/or concerns that they might have, and keep an open dialogue with them throughout the whole development.
  • Consultation with the Public near the site
    The local community who are likely to be affected by the proposal must be met to present the project, solicit their feedback and seek their support. An advertisement in the local paper would be a good idea to inform the general public and invite them for a discussion and debate.
  • Land acquisition
    Early in the process, developers, if not already the owners themselves usually approach landowners to negotiate “option” agreements to use their land. As the project progresses, the developer will seek to convert the options into firm land lease agreements.
  • Wind Assessment
    Another very important step is assessing the wind resource. Scientists and engineers use meteorological masts to measure wind speed and other climatic conditions for at least one year. This data is then used to estimate how much energy the wind farm will produce. It is often assumed that this has to be carried out before any serious consideration is planned.
  • Wind Farm Design
    This is important if the project is a wind farm, Wind data is combined with topographical information to design the wind farm. Engineers use this data to model wind flow, turbine performance, sound levels and other parameters to optimize the location of the wind turbines. They also design the access roads, turbine foundations and local electric network, as well as the connection to the electricity grid.Wind farm optimal placement
Figure 2.3 Wind farm optimal placement
  • Environmental Impact Assessment
    Environmental assessments are conducted to identify any impacts on landscape, plants and wildlife, soil and water, land use or other activities such as aviation and telecommunications. If negative impacts are identified, the design is adjusted to avoid or mitigate them.
  • Economic and Financial evaluation
    To prove the economic viability of the project in order to raise the funds to build the wind farm. On one hand, there is a need to estimate the cost of turbines and their installation, as well as roads, electrical system, operation and maintenance, etc. On the other hand, there is a need to estimate the income from the energy production of the wind farm over the lifetime of the project. If there is a net profit, the project has a chance to succeed.
  • Site Preparation
    Build access roads and clear the areas where turbines will be erected; then prepare the foundations; do the excavating, followed by installing the formworks and pouring concrete.
  • Construction
    The wind turbine parts are manufactured and pre-assembled into the main components at the factory then shipped to the wind farm site where the final assembly will take place. When all components have been received, the assembly can take place. A crane is used to erect the tower and install the nacelle and rotor with its hub and blades. On the ground, the electrical collection network is installed and connected to the grid through the substation.
  • Commissioning
    Finally, the wind turbine is tested, all components are calibrated on site and verified against the suppliers specifications, before becoming fully operational.

Wind Energy and the Environment


previous Steps to Planning and Building a Wind Farm
Positive environmental benefits of Wind energy
It must be stressed that wind energy involves no combustion or nuclear reaction, so it is pollution free. It is renewable and plentiful and free, and what is more it is available everywhere, especially in remote areas and often it is windier in mountains and near costal areas. There are significant environmental benefits obtained from using a renewable energy device attributed to preventing the release of Green house gases associated with fossil fuels. The general equation for estimating the reduction in emitted gas is:
Gas-emission reduction (in tonnes) = A × 0.8 × h × kG
Where
A is the rated capacity of the development in kW
h is the number of operational hours per year, = 8000 h
kG is the specific emitted gas constant.
Hence the following equations are used to predict environmental benefits from based on 1 kWe system:
CO2 emission reduction (in tonnes) = 1 × 0.8x8000 × 862/106 = 5.5
SO2 emission reduction (in tonnes) = 1 × 0.8 × 8000 × 9.9/106 = 0.063
NO2 emission reduction (in tonnes) = 1 × 0.8 × 8000 × 862/106 = 0.018
Negative Impacts of Wind energy
These issues are often raised, some are valid, some are opinion driven, and others could be due to personal preferences or biasness.
a. Noise
Wind turbines rely on the movement of the rotor affected by wind to rotate the generator and make electricity. Virtually everything with moving parts will make some sound, and wind turbines are no exception. Turbines are an established and well developed technology, and well designed wind turbines are generally quiet in operation, and compared to the noise of road traffic, trains, aircraft and construction activities, the noise from wind turbines is relatively low. Outside the nearest houses, which are at least half a mile away, and more often further, the sound of a wind turbine generating electricity is likely to be about the same level as noise of leaves rustling in a gentle breeze. This is similar to the sound level inside a typical living room with a gas fire switched on, or the reading room of a library or in an unoccupied, quiet, air-conditioned office.
Source/Activity
Indicative noise level dB (A)
Threshold of hearing
0
Rural night-time background
20-40
Quiet bedroom
35
Wind farm at 350m
35-45
Car at 40mph at 100m
55
Busy general office
60
Truck at 30mph at 100m
65
Pneumatic drill at 7m
95
Jet aircraft at 250m
105
Threshold of pain
140
Table 2.1 Comparative noise levels
There are two potential sources of noise related to wind turbines: the turbine blades passing through the air as the hub rotates, and the gearbox and generator in the nacelle. Noise from the blades is minimised by careful attention to the design and manufacture of the blades. The noise from the gearbox and generator is contained within the nacelle by sound insulation and isolation materials.
Preliminary recommendations from the Wind Turbine Noise Working Group, established by the DTI in the UK, are that turbine noise level should be kept to within 5 dB(A) of the average existing evening or night-time background noise level. A fixed low level of between 35 and 40 dB(A) may be specified when background noise is very low, ie. Less than 30 dB(A).
b. Bird-kill
This is a very emotionally charged subject. Bird conservationists tend to view wind turbines as death machines and refer to bloody bird corpses lying at the foot of turbine towers and entire species migrating from the areas surrounding wind farms.
Birds occasionally collide with wind turbines, as they do with other tall structures such as buildings. Detailed studies and monitoring following construction, at wind development areas indicate that this is a site-specific issue that will not be a problem at most potential wind sites. Also, wind's overall impact on birds is low compared with other human-related sources of avian mortality. See Figure 2.4
Causes of Bird-kill Figure 2.4 Causes of Bird-kill
c. Visual impacts
Wind turbines are just normal structures to look at, just like trees, better looking than boiler chimneys. In comparison to other energy developments, such as nuclear, coal and gas power stations or open cast coal mining, wind farms have relatively little visual impact. Wind farm developers recognise that visual impact can be a concern for neighbouring communities. Considerable effort is therefore committed to the planning stages in order to reduce the impact and gain their consent.
A number of national wind energy associations have established detailed best practice guidelines for the development of wind farms, including their visual impact.
Surveys of public opinion show that most people who live near wind developments find them less intrusive once they are operating than they might have feared beforehand. Other surveys, for instance in Scotland, have shown that there is no evidence that tourism is seriously affected by the presence of wind farms. The authors experience is the opposite to that, I found myself going to places never thought I would, for the simple reason to see how the wind turbines work and enjoy the view of clean energy machine.
Although a wind energy project can spread across a large total land area, it does not occupy all that space. Farming or leisure activities can still continue around the turbines. The European Wind Energy Association has estimated that the number of wind farms required to contribute 20% of Europe’s electricity supply would take up only a few hundred square kilometres.
d. Shadow Flicker
is occasionally raised as an issue by some people. A wind turbine's moving blades can cast a moving shadow on a nearby residence, depending on the time of the year (which determines how low the sun is in the sky) and time of day. It is possible to calculate very precisely whether a flickering shadow will in fact fall on a given location near a wind farm, and how many hours in a year it will do so. Therefore, it should be easy to determine whether this is a potential problem.
e. Communication interference
Wind turbines, like all structures, can interfere with communication or radar signals when these signals are interrupted by the turbine structure or the rotor plane. Wind turbines can sometimes cause electromagnetic interference affecting TV and radio reception. Electromagnetic interference can be caused by near-field effects, diffraction, or reflection and scattering. Such interference can typically be mitigated by using satellite TV or wireless cable TV. Although instances of TV or radio interference are infrequent and typically straightforward to mitigate, the interaction of wind turbines and navigational or defence radar signals is the subject of considerable recent attention.
A number of tools and practices are available to manage or mitigate the potential impact of wind turbine
interference:
  • Farm layout optimization, terrain masking, or reduction of the radar cross-section area may be sufficient to address identified interference problems.
  • Coating equipment with absorbent or reflective materials to minimize the turbine's radar signature.
  • Often the easiest and least costly approaches involve software optimization. Other options include installing post-processors or adding hardware (such as processors, transmitters, or receivers). When such changes alone are insufficient, more involved approaches can sometimes be implemented. These include deploying extra radars to cover the shadow spots, relocating radar installations to accommodate the new wind farms, or altering air traffic routes around new wind farms.
Even with these mitigation methods, there will be some proposed locations where wind turbines will cause disruptive radar interference. In such cases, wind projects would likely be unable to proceed at the proposed site.
“Not” a perfect place to site a wind farm Figure 2.5 “Not” a perfect place to site a wind farm.

Theory of Wind Energy


previous Wind Energy and the Environment


The principles concerned with converting the potential energy of fluids into useful power relies on three basic fundamentals: conservation of mass, energy and momentum, so it is useful to discuss these before examining the operation of wind turbines.
Conservation of Mass:
The continuity equation applies the principle of conservation of mass to fluid flow. Consider a fluid flowing through a fixed conduit having one inlet and one outlet as shown in Figure 3.1


Conservation of mass of a fluid flowing in a duct/pipe Figure 3.1 Conservation of mass of a fluid flowing in a duct/pipe
If the flow is steady i.e no accumulation of fluid within the control volume, then the rate of fluid flow at entry must be equal to the rate of fluid flow at exit for mass conservation. If the flow cross-sectional area A (m2), and the fluid parcel travels a distance dL in time dt, then the volume flow rate (Vf, m3/s) is given by:
Vf = A.dL / dt
but since dL/dt is the fluid velocity (V, m/s) we can write: Vf = V × A
The mass flow rate (m, kg/s) is given by the product of density and volume flow rate. Between any two points within the control volume, the fluid mass flow rate can be shown to remain constant:
or   ρ1A1V1 = ρ2A2V2             (1)
Conservation of Energy:
Conservation of energy necessitates that the total energy of the fluid remains constant, however, there can be transformation from one form to another.
There are three forms of non-thermal energy for a fluid at any given point:-
The kinetic energy due to the motion of the fluid.
The potential energy due to the positional elevation above a datum.
The pressure energy, due to the absolute pressure of the fluid at that point.
If all energy terms are written in the form of the head (potential energy), ie in metres of the fluid, then conservation of energy principle requires that:
10
This equation is known as the Bernoulli equation and is valid if the two points of interest 1 & 2 are very close to each other and there is no loss of energy.
In a real situation, the flow will suffer a loss of energy due to friction (hL) and obstruction between stations 1 & 2, hence
11
Conservation of Momentum:
Consider a duct of length L, cross-sectional area Ac, surface area As, in which a fluid of density ρ, is flowing at mean velocity V. The forces acting on a segment of the duct are that due to pressure difference and that due to friction at the walls in contact with the fluid.
If the acceleration of the fluid is zero, the net forces acting on the element must be zero, hence
12
This is known as Darcy formula.
The value of the friction factor (f) depends mainly on two parameters namely the value of the Reynolds number and the surface roughness.
The Reynolds number is defined in terms of the density, velocity of flow, diameter and the dynamic viscosity as follows:
13
For laminar flow (ie Re < 2000),
14
While for a smooth pipe with turbulent (i.e. Re > 4000) flow,
15
For Re > 2000 and Re < 4000, this region is known as the critical zone and the value of the friction factor is certain.
In the turbulent zone, if the surface of the pipe is not perfectly smooth, then the value of the friction factor has to be determined from the Moody diagram . The relative roughness is the ratio of the average height of the surface projections on the inside of the pipe (k) to the pipe diameter (D). In common with Reynolds number and friction factor this parameter is dimensionless.
next Ideal Wind Power calculations

Ideal Wind Power calculations


previous Theory of Wind Energy


In Theory, Wind power (P) is calculated by the following general equation (the proof for which will be derived in the following section):

16


Where
Cp is the power coefficient
ρ is the density of the oncoming air
A swept area of the rotor
V is the velocity of the wind
The actual power is further reduced by two more inefficiencies, due to the gear box losses and the generator efficiency.
The value of the ideal power is limited by what is know as Betz coefficient with a value of Cp = 0.59 as the highest possible conversion efficiency possible.
In practice, most wind turbines have efficiencies well below 0.5, depending on the type, design and operational conditions.
In the operational output range, wind power generated increases with wind speed cubed. In other words, at a wind speed of 5 m/s, the power output is proportional with 5 cubed = 125, whereas at a wind speed of 10 m/s, the power output is proportional to 1000. This shows that doubling the speed from 5 to 10 m/s resulted in a power increase of 8 folds. This highlights the importance of location when it comes to install wind turbines. The effect of the rotor diameter affect the power output in a square manner, i.e, doubling the rotor diameter results in increasing the power output by four times.
On the other hand, since power generated is related to wind speed by a cubic ratio. That means if your turbine is rated at producing 1KW at 12m/s then it will produce 125W at 6m/s and 15W at 3m/s.
next Theory of Wind Turbines

Theory of Wind Turbines


previous Ideal Wind Power calculations


A windmill extracts power from the wind by slowing down the wind. At stand still, the rotor obviously produces no power, and at very high rotational speeds the air is more or less blocked by the rotor, and again no power is produced.


Ideal Wind Energy Theory Figure 3.2 Ideal Wind Energy Theory.
The Power produced (Pkin) by the wind turbine is the net kinetic energy change across the wind turbine (from initial air velocity of V1 to a turbine exit air velocity of V2) is given as:
18


The mass flow rate of wind is given by the continuity equation as the product of density, area swept by the turbine rotor and the approach air velocity as:
19
Hence the power becomes:
20
Since the rotor speed is the average speed (Va) between inlet and outlet:
21
Hence, the power is
22
To find the maximum power extracted by the rotor, differentiate equation 11 with respect to V2 and equate it to zero
23
Since the area of the rotor (A) and the density of the air (r) cannot be zero, the expression in the bracket of equation 12 has to be zero. Hence, the quadratic equation becomes:
            (3V2 – V1) (V2 + V1) = 0
Since V2 = - V1 is unrealistic in this situation, there is only one solution, equation 12 yields:
24
Substitution of equation 13 into equation 11 results in:
25
The theoretical maximum fraction of the power in the wind which could be extracted by an ideal windmill is, therefore the fraction 0.5925 is called the Betz Coefficient. Because of aerodynamic imperfections in any practical machine and of mechanical loses, the power extracted is less than that calculated above. Figure 3.7 demonstrates the effect of wind turbine design implications on the resulting power that can be harnessed from the incoming wind. Efficient wind turbines depend on the production of that optimum speed ratio giving the maximum or near the maximum power possible.
Equation 14 clearly shows that:
  • The power is proportional to the density (ρ) of the air which varies slightly with altitude and temperature
  • The power is proportional to the area (A) swept by the blades and thus to the square of the radius (R) of the rotor; and
  • the power varies with the cube of the wind speed (V3). This means that the power increases eightfold if the wind speed is doubled. Hence, one has to pay particular attention in site selection.
Distinction between rated and actual power output of the turbine
The world's largest wind turbine generator has a rotor blade diameter of 126 metres and is located on offshore, at sea-level and so we know the air density is 1.2 kg/m3. The turbine is rated at 5MW in 30mph (14m/s) winds,
Rotor Swept area A= (π. 1262)/4 = 12469 m2
Wind Power = 0.5 × A × ρ × V3 = 0.5 × 12469 × 1.2 × (14)3 = 20.5 MW
Why is the power of the wind (20MW) so much larger than the rated power of the turbine generator (5MW)?
The answer lies in the fact that the Betz limit and inefficiencies in the system seriously absorbs over 60% of the apparent power.
There are two further factors to be considered when estimating the power output from a turbine, the first is the mechanical transmission and the second is the generator’s efficiency, both of which are less than unity, hence the real power is proportionately less than the ideal value.
The capacity factor, Cf. Assuming a 5 kW wind turbine generates annually 10 MWh, if that same installation had run – theoretically – 24 hours a day and 365 days a year at full load, it would have generated 43.8 MWh. The capacity factor (Cf) is 10/43.8 = 0.23. Typical values for Cf between 0.2 and 0.4 in the united kingdom, depending on the exact location.
26 Figure 3.3 Betz Limit on wind energy efficiency and its Implications.
next Wind Turbines types and components